“It is well enough that people of the nation do not understand our banking and monetary system, for if they did, I believe there would be a revolution before tomorrow morning.
Henry Ford, 1922
The Price of money is reflected in its ability to pay interest back at a rate set by the marketplace. (the yield or interest of credit instruments, i.e., sovereign bonds, municipal bonds, corporate bonds, CDs, etc.)
In other words - it’s the cost one incurs to borrow money.
The lower the cost of money incentivizes excess credit creation, i.e., more borrowing, which leads to more instability in the financial system. Lower quality lending practices encourage; speculation, the zombification of enterprise, and decreasing quality of borrowers. When the Price of money is Higher, the opposite is true.
US National Debt trajectory - deficit spending growing at an ever increasing rate.
Central bank (Federal Reserve) debt held on their balance sheet as a percentage of Gross Domestic Product, i.e., our economy.
The Federal Reserve is quickly becoming the largest holder of US Treasury debt (the instrument used to finance our spending).
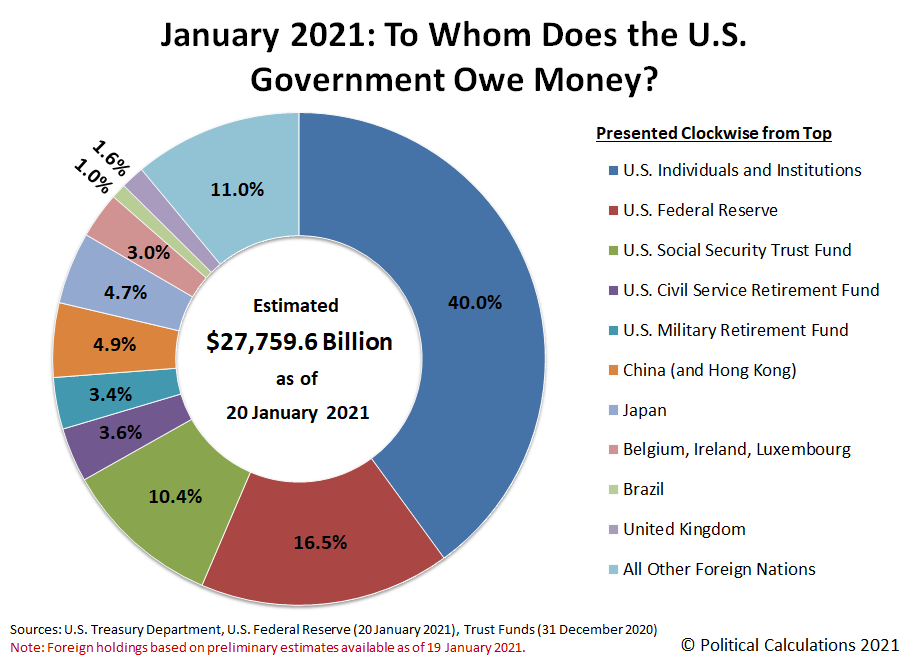
The largest exposure to our national debt is found here at home. As of January 2021, 73.9% of outstanding debt is held by U.S. entities. NOT China.
Each additional $1 of debt has an ever decreasing impact on economic growth, i.e., GDP (Gross Domestic Product)
Debt financing is quickly becoming anti-productive. You need more, and you get less for it.
Net Treasury issuance (green line) started increasing again in 2016, however foreign investment in Treasuries didn’t follow suit. In fact, foreign governments have been net sellers during the last 5 years. This dynamic is new and seems to be gaining steam as foreigners have accellerated their liquidation of Treasuries. (Early stages of a US fiscal crisis brewing)
Yep, issuance is parabolic.
What does this mean for the US? As you can see, we are running a deficit that is moving in the wrong direction weakening our ability to compete on the global stage (foreigners own more of us than we own of them).
The red shaded area reflects ‘total’ national deficit spending per year since 1990. Dark red is annual trade and light red is the annual budget. The green line represents the value of the U.S. Dollar. The U.S. Dollar tends to follow either deficits or surpluses.
As you can see COVID has set off an acceleration of deficit spending. All eyes lie squarely on the currency (value of the dollar).
A key component to funding this large deficit spending will require an ever decreasing ‘real’ interest rate. SEE CHART BELOW
Interest rates are stated in ‘Nominal’ terms. When you get a mortgage, invest in a CD or bond, or simply open a credit card you are given a fixed or variable interest rate quote… that is the ‘nominal’ rate. The ‘effective’ rate is the ‘nominal’ rate minus the inflation rate, i.e., CPI (Consumer Price Index).
The Fed Funds Rate is the interest rate ‘set’ by the Federal Reserve. This is the rate received by the largest financial institutions who consume/buy those short-term instruments/investments.
The Fed Funds Rate is set by central banks but the 10yr Treasury rate is set by the market. The more debt a country issues the more burdened it becomes to service existing and new debt. As long as long term bonds remain affordable i.e., interest rates low, then debt stays serviceable at current levels. When the market rate of the 10yr Treasury reverses course and begins rising… we have a big problem. We have a debt trap.
Nouriel Roubini is an Iranian-American economist.[1] He teaches at New York University's Stern School of Business and is chairman of Roubini Macro Associates LLC, an economic consultancy firm.
The child of Iranian Jews, he was born in Turkey and grew up in Italy. After receiving a BA in political economics at Bocconi University, Milan and a doctorate in international economics at Harvard University, he became an academic at Yale and a visiting researcher/advisor at the International Monetary Fund (IMF), the Federal Reserve, World Bank, and Bank of Israel.
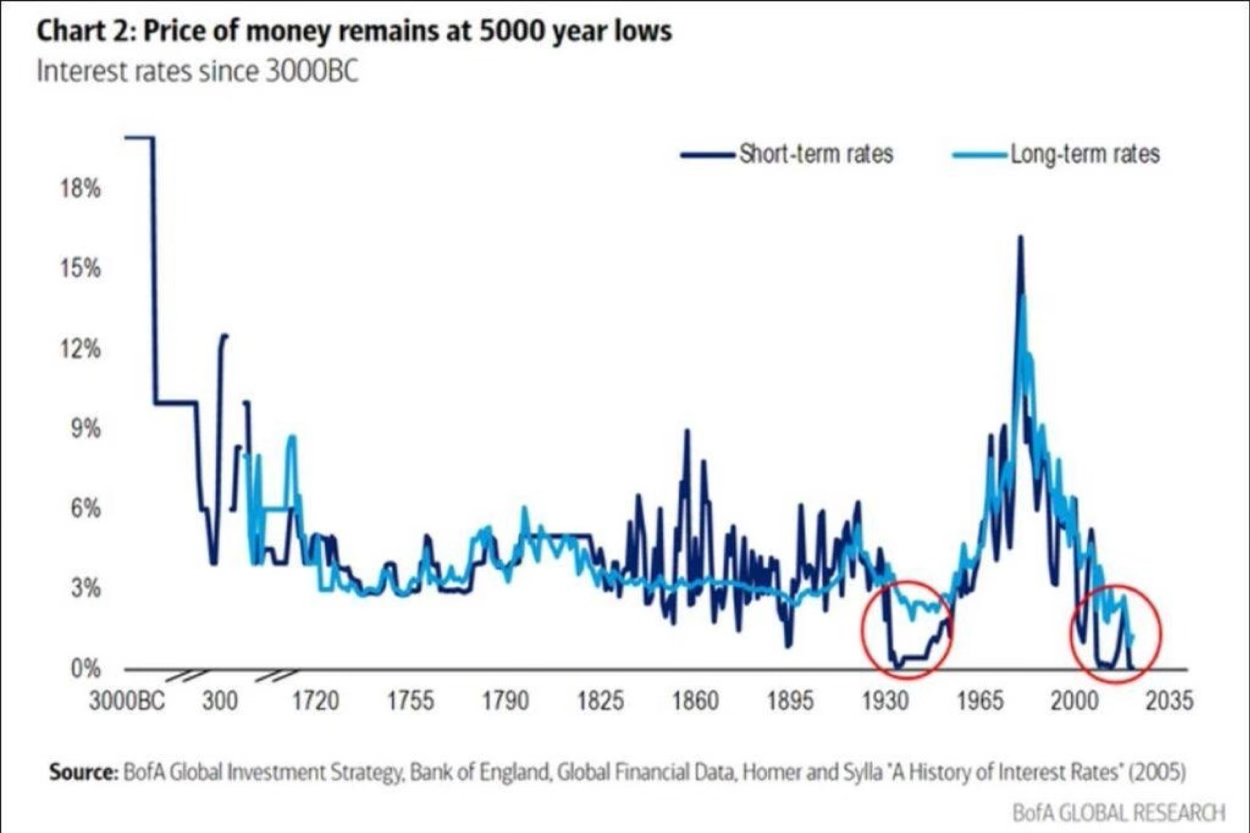
A long term view on the price of money indicated by the U.S. 10 year treasury bond. This is considered (by modern finance) as the ‘risk free rate’ of return. ‘Risk Free’ because the bond is backed by the full faith and credit of the United States (issuer of the debt). All risk assets derive their prices off of this metric. It’s the measure of assets globally. It is the linch pin of the financial system.
The appetite to consume more on the back of rising prices is at the weakest level in decades. Many are waiting for prices to come down before making large purchases assuming its a temporary (transitory) phenomenon. We shall see. This dynamic could reverse quickly if consumers belief that prices will continue to increase therefore destabilizing the ‘temporary’ narrative currently (2021) shared by the majority.
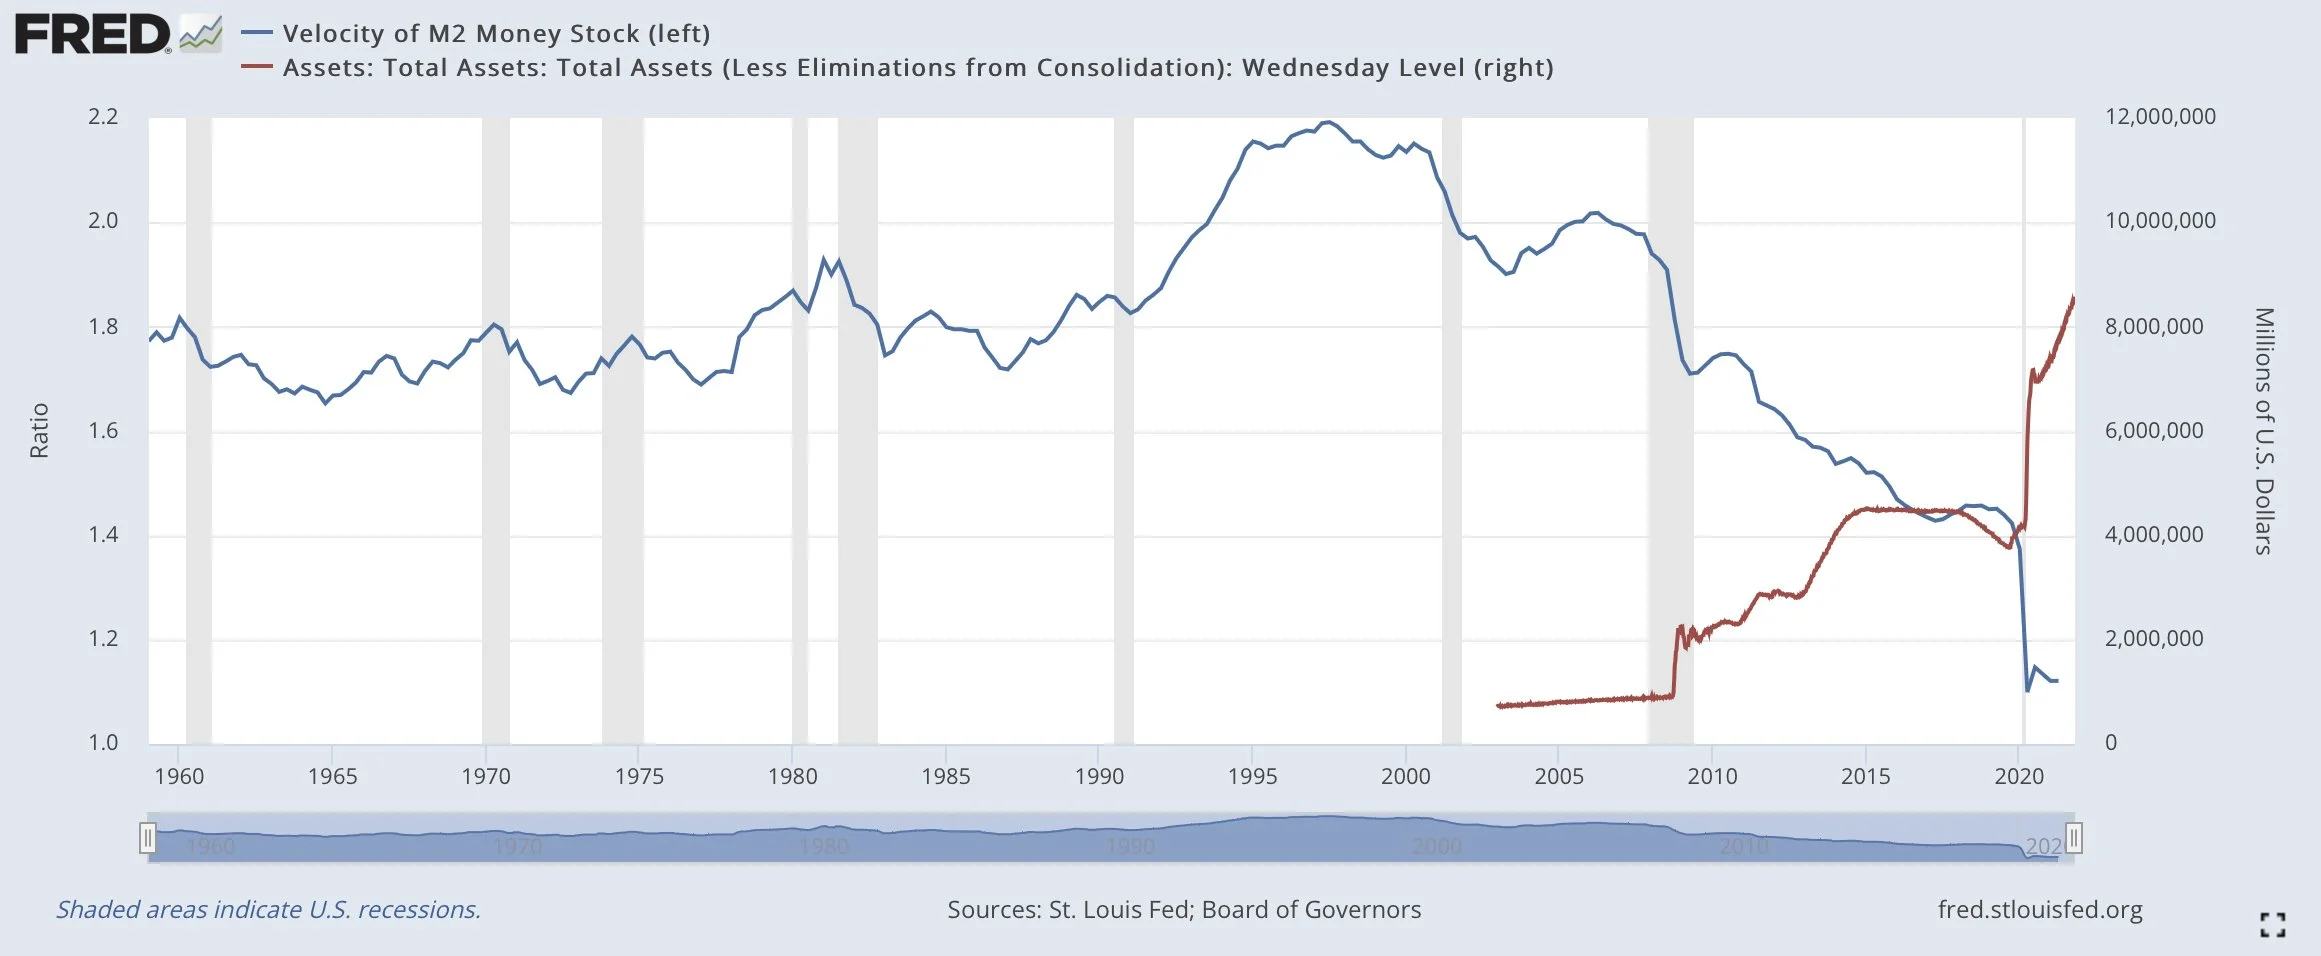
Velocity of money is the rate at which money circulates in the economy. There was significant increase in money creation since the great financial crisis of 2008 but that doubled in short order during the Covid crisis in 2020. It’s been growing at a rate of $120B/month since that initial boost. There are lots of dollars sloshing around in the system currently but since the volume of dollars in circulation are way up it’s having trouble finding a home. This dynamic can reverse course, especially if the consumer changed behavior. That behavior depends on temporary or persistent longer lasting inflation.
Labor Force Participation Rate is the measure of our economies ‘active workforce’. Those employed or actively looking for work divided by the total civilian working-age population, i.e., 15-64 years old.
Total Assets is a measure of the Federal Reserves balance sheet of assets they’ve actively purchased and now hold… primarily made up of U.S. Treasury bonds and mortgage backed securities, i.e., housing bonds. The correlation to a weak labor force and Federal Reserve intervention is high. As the Fed continues to buy our government issued debt the broad economy appears to be weakened by this action from our central bank.
Retail sales reflect the confidence of the consumer and are highly correlated to employment. If the workforce is strong the people feel more able to consume. The pandemic has distorted this signal significantly. High retail sales but weak employment conditions. You can thank the policy response because of the pandemic for surging retail demand. Cash was dropped at an epic rate by government to the people so they could spend… and they did.
A Global Reserve Currency is a ‘currency’ that dominates trade settlements globally in that currency. The U.S. Dollar has been dominate in trade for about 100 years give or take. Previously, the pound/sterling was dominant prior to the emergence of the U.S. financial dominance.
The “Cost of Living Index” measures whether it’s easier or harder to make ends meet today than in the past (spoiler alert: it’s harder today)
The Federal Reserve created the Phillips Curve to measure the economic cycle and inform the path of monetary policy. This puts policy in a box in our estimation and thus creates a dynamic that is static. We simply ask the question to the authority (the Fed), what happens when inflation is high and labor is weak, i.e., stagflation? What policy response is required to combat those symptoms? Raise rates to fight inflation or cut taxes to support economy/labor recovery? You can’t have both!